Tampering with the Universes
- H-Barrio

- Mar 2, 2021
- 5 min read
Updated: Mar 8, 2021
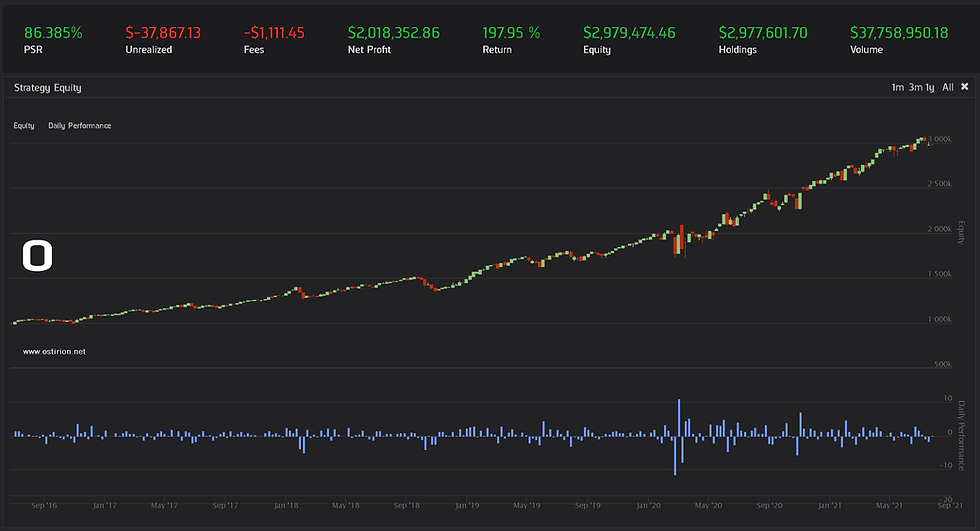
Now that we have this very flexible universe selection model, we can easily tamper with it and experiment with multiple strategies involving certain cross-sections of the stock universe. We can even start with the Capital Asset Management Model using the factor that is more easily described by a fundamental cross-sectional universe selection: large and small companies. Even if we should make this cross-sectional selection by market capitalization (which we could do), we will first try with traded volume as a proxy for simplicity. We are investigating, thus, the return variation in an "interest" factor more than a size risk factor. We will update our universe by traded volume every month and enter positions in the top 25 traded stocks for one month; then, we will do the same for the 25 least volume assets. We will limit our analysis to the past five years, a strong market with two deep and short crisis periods. For the top traded assets, these are the results:

At a healthy, unusual, 176% return, this universe is a rarity by its strength. A 22% cumulative annual growth at a Sharpe ratio of 1 are good results, shows a strong market with quick recoveries for those stocks with large interest. The names involved in this top volume portfolio are household names, not Harry the king, Bedford and Exeter, Warwick and Talbot, Salisbury and Gloucester, but Apple, Facebook, Morgan, and Berkshire:

On the other side of the traded volume spectrum, we obtain these results:

Returns are lower, Sharpe ratio is lower. We are arbitrarily chopping off the bottom at the 1000 stocks limit to prevent trading problems with extremely rare stocks; still, the names that appear in this case are not widely spoken of: Watsco (air conditioning systems distributor), Moog (fluid control products for aero and defense industries, we knew them in another life), Discovery Channel. Some of these are ".letter" series of stocks, different classes of the same underlying company. We are not filtering them this time; this filtering can be implemented in the universe selection and obtain class A or B stock titles depending on the voting rights it provides, is just a matter of "regexing" out "." strings in the ticker names.

It is interesting, and notable, that the beta value for both strategies: -0.18 for top volumes and -0.08 for low volumes, a relatively large inverse correlation from the SPY index. This beta relationship seems strangely counter-intuitive and may warrant further research, starting at, for example, this paper: "Trading Volume and Beta Stability". (2021-03-08 edition: see this post for a correction, there is no strange beta effect at play here).
We can dig deeper into unusual cross-sections; we will skip returns and value from the classic Fama-French model as these require additional fundamental and price action modeling. As our universe model allows for controlling the "age" of the company; we can set limits for the time elapsed since the Initial Public Offering of the company and create a model that will hold for a month either the newest companies or the oldest ones. An age-related risk factor. By holding for one month those companies that have their IPO date within the month, we managed to (almost) ruin ourselves:

Volatility appears to be high around IPO periods for these newcomers; it can generate very high gains and very large losses. There may be an opportunity to trade into volatility in this "Club of the New" universe, possibly using complex options arrangements that will capitalize on the price moving grandiosely one month after the IPO, either up or down. There is also the possibility that the pricing of options around IPO dates is highly efficient and already reflects this IPO effect, reducing arbitration opportunities.
The members of The Club of the New since 2016 have been these:

US Food Holdings (USFD, link not working for us), Twilio (TWLO), Fortive (FTV), Valvoline (VVV, a divestion) are among the companies that entered a public offering of stock and had their prices dance around the board.
If we take the companies that are "not new", with IPO dates more than 25 years away, we end up with a very different equity profile:

These "not new" are established companies and are the household names mentioned before minus the younger ones:

We can go further in time and invest only in the venerable companies that initiated their public offering more than 50 years ago:

These venerable companies seem to be going nowhere but where the market is taking them. These are established enough as not to draw attention:

Exxon (XOM), AT&T (T), Boeing (BA), and airline operators are here, among other sectors. These are names that the world has had time to learn to love or hate; in normal market conditions, they exhibit the opposite volatility behavior to The New and stay put within their price limits.
At this point, we may just section our universe by the price level of the security. This is the 9.99 effect, our hypothesis is that different price levels make investing in some companies more or less desirable irrespective of any other consideration. Checking for price values between 99 and 101 USD we obtain these results:

We struck gold at the 99.99 trap. The Sharpe ratio is almost one and the compounding annual return 23%. Not bad for a strategy that ignores everything but the price, when it is widely accepted that the price itself carries zero information. It is also widely accepted that the price contains all the information, so this is a tie, academically speaking. What for the ultra-expensive stocks? In theory, these high prices will limit the ability of some market participant to diversify their portfolios, and some effect should be at play for stocks with prices above 1000USD:

The "very expensives" also do very well. These are highly concentrated as these are generally Berkshire, Google, Google (again with their diversification trap at a high price), Tesla (sometimes), and NVR.
What about the cheap ones, those companies with significant volume and a price below 5 USD?

These have strong sideways movement, possibly as they oscillate below and above the psychological limit of 5 USD back and forth until the market breaks down and rebounds.
These backtests are not statistically significant; these reflect the latest behavior of the market for these unusual factor models. There may be real, statistically significant effects in these cross-sections; an extended look-back period is needed to verify and gain confidence in these medium-term behaviors of selective cross-sections. For the time being, the model used to generate these universe portfolios is included below for your own tampering with the universe. Note that some of the mentioned companies may have minor data errors that can be walked-around by explicitly excluding them from our analysis when detected.
Information in ostirion.net does not constitute financial advice; we do not hold positions in any of the companies or assets that we mention in our posts at the time of posting. If you require quantitative model development, deployment, verification, or validation, do not hesitate and contact us. We will also be glad to help you with your machine learning or artificial intelligence challenges when applied to asset management, trading, or risk evaluations.
The model used in this post:

Comments