Simple Technical Analysis for Cryptocurrencies.
- H-Barrio

- Jul 13, 2020
- 6 min read
Updated: Jul 14, 2020
At Ostirion we do not like cryptocurrencies a lot, at the same time we acknowledge that these are a necessity to have in any well balanced, well diversified asset portfolio. We do not like it at this stage for the excessive "intrinsic value" that apparently exists in these cryptocurrencies, we abhor the mechanisms that are now pricing cryptocurrencies such as Bitcoin with the limited observability of the underlying products of services that can be exchanged for the currency. We may have high frequency tulipmanias happening, and this distracts from the very good mechanisms that a decentralized, stateless (nationless), digitized currency can enable in the future.
Regarding the exchanges where these assets are priced even those with very good reputation exhibit a "look-and-feel" similar to a hybrid of Pac-Man and a Casino. Take as an example Coinbase look and feel, with the disclaimer that we consider it a very good exchange and use it:


We can see two things, technology and fun, it is difficult to discover where sound asset management fits in the world of flashy interfaces and volatile prices. In any case, our customers have required us in the past support on navigating this neon world of cryptocurrencies and prepare recommendations for operation and storage, for which we generally recommend hardware wallets, a topic that will be covered in a future post.
Our analysis of algorithmically trading cryptocurrencies begins with a look into the past, a past in which we could have believed ourselves rich. This look into the past implements a simple Bitcoin buy and hold strategy starting in 2016, date for which it is considered that market historical data is sufficiently accurate. Using Quantconnect lean engine this is the code for and the result of an EUR to BTC buy and hold strategy, note that we need to add some USD to the initial cash to kick-off our EUR operations:
import decimal as d### Buy and Hold Bitcoin from EUR and USD.class CryptoBuyAndHold(QCAlgorithm): def Initialize(self): self.SetStartDate(2016, 1, 1) #Set Start Date self.SetEndDate(2020, 7, 1) #Set End Date # Set Strategy Cash in USD and the EUR self.SetCash(10000) self.SetCash("EUR", 10000) # Set the Brokerage Model: self.SetBrokerageModel(BrokerageName.GDAX, AccountType.Cash) # Add BitCoin/Euro Market self.symbol = self.AddCrypto("BTCEUR", Resolution.Daily).Symbol
def OnData(self, data): if self.Securities[self.symbol].Invested: return limitPrice = round(data[self.symbol].Close * d.Decimal(1.005), 2) quantity = round(self.Portfolio.CashBook["EUR"].Amount/d.Decimal(1.005), 2) self.LimitOrder(self.symbol, quantity/limitPrice, limitPrice) returnThe buy-and-hold simulation yields these now famous results:

Our simulated 10.000 EUR became almost half a million EUR in 2 years, then we lamented ourselves for not selling at the "then-impossible-to-predict" moment, it did not matter as two years later we have still 234K EUR in our balance. This simulation illustrates our distrust for cryptocurrencies, risk-reward ratios of these magnitudes are difficult to manage properly and add that "pac-man casino" layer of technologically fueled fear and greed cycles. We will be always trapped between the fear of missing out and the stress associated to large principal losses.
What can we do, if anything, to bring a little bit more of stability to cryptocurrency holdings? More stability will make it more appealing to a certain group of investors and savers that want exposure to cryptocurrencies and are at the same time terrified by the buy and hold results chart. We are aiming at a model that maintains cryptocurrency exposure, maintains gains, not necessarily a 1.000%, which is probably in the greedy side, and reduces volatility.
Taking into account that the market is, relatively speaking, in its infancy and that cryptocurrencies may behave as currencies we can start our approach to a trading model using technical indicators. Technical indicators are "popular" in the foreign currency exchange markets and are notorious and infamous for their lack of traditional academic support. In the face of the difficulty of applying fundamental and valuations methods to these cryptocurrency markets (a task we may undertake in the future, far future) technical analysis becomes the path of least resistance. Besides, there is another reason to use technical indicators: our market provider embeds Exponential Moving Averages in their user interface:

Specifically, EMA12 and EMA26, with their beautiful crossovers are part of the default Coinbase interface. Is this indicator popular? If yes, then it may offer an advantage in trading out of sheer faith. Note that here at Ostirion.net we do not like indicators that do not use OCHL and the trading volume as an input, as the traded volume and price actions are necessary pieces of information, the bare minimum the market offers you and that you have to take. EMA12 and EMA26 are also the notorious EMA´s used in baseline Moving Average Convergence-Divergence technical models, so let's try these indicators in a simple buy-hold-sell model:
import decimal as dfrom collections import deque### This algorithm employs EMA Convergence Divergence Indicator### to generate buy and sell signal for Bitcoin/Euro exchange.
class CryptoEMACD(QCAlgorithm):
def Initialize(self): #Set Start and End dates: self.SetStartDate(2015, 1, 1) self.SetEndDate(2020, 7, 1) # Set Strategy Cash-USD, USD are needed to start the EUR/USD conversion. self.SetCash(10000) # Set Strategy Cash-EUR, we add the EUR we need, we are trading from Europe # and the BTCUSD market is not available. self.SetCash("EUR", 10000) # Limit price multiplier: self.spread = 1.005 # Set up the GDAX (Coinbase) brokerage model. self.SetBrokerageModel(BrokerageName.GDAX, AccountType.Cash) # Use only BitCoin, it can be extended to any other crypto: self.symbol = self.AddCrypto("BTCEUR", Resolution.Daily).Symbol #Symbol Data Dictionary: self.symbol_data = {} # Indicator Parameters # 12 period and 26 period EMA, 9 period C-D line: self.ind_params = (12,26,9) #Create symbol data object for symbol self.InitizalizeSymbolData(self.symbol, self.ind_params) def OnData(self, data): for key, symbol_data in self.symbol_data.items(): symbol_data.ComputeStatus(data[key]) if symbol_data.is_buy == True: if self.Portfolio[key].Invested: continue limitPrice = round(data[key].Close * d.Decimal(self.spread), 2) quantity = round(self.Portfolio.CashBook["EUR"].Amount/d.Decimal(1.01), 2) self.LimitOrder(key, quantity/limitPrice, limitPrice) if symbol_data.is_sell == True: limitPrice = round(data[key].Close / d.Decimal(self.spread), 2) quantity = self.Portfolio.CashBook["BTC"].Amount self.LimitOrder(key, -quantity, limitPrice) self.control = False def InitizalizeSymbolData(self, symbol, parameters): self.symbol_data[symbol] = SymbolData(self, symbol, parameters) needed_period = max([*parameters]) history = self.History(symbol, needed_period, Resolution.Daily) if not history.empty: self.symbol_data[symbol].WarmUpIndicators(history)
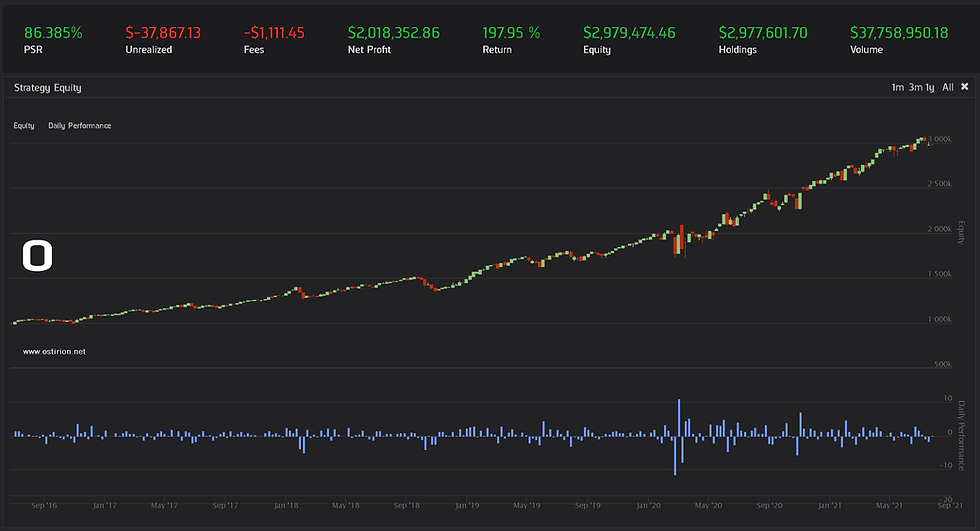
class SymbolData(object): def __init__(self, algorithm, symbol, parameters): self.symbol = symbol self.indicator = algorithm.MACD(self.symbol,*parameters, MovingAverageType.Exponential, Resolution.Daily) #Indicator histories, as len 2 deques: self.emafast_history = deque([],2) self.emaslow_history = deque([],2) self.is_buy = False self.is_sell = False def WarmUpIndicators(self, history): for index, row in history.loc[str(self.symbol)].iterrows(): self.indicator.Update(index, row["close"]) self.emafast_history.append(self.indicator.Fast.Current.Value) self.emaslow_history.append(self.indicator.Slow.Current.Value) def ComputeStatus(self, data): #Update indicator history: self.emafast_history.append(self.indicator.Fast.Current.Value) self.emaslow_history.append(self.indicator.Slow.Current.Value) # Compute if the EMA lines cross over or under, # In the deque object, -1 is most current, 0 is past, just 2 values: # Gloden Cross: if (self.emafast_history[-1] > self.emaslow_history[-1]) and (self.emafast_history[0] < self.emaslow_history[0]): self.is_buy = True self.is_sell = False # Death Cross: elif (self.emafast_history[-1] < self.emaslow_history[-1]) and (self.emafast_history[0] > self.emaslow_history[0]): self.is_buy = False self.is_sell = True else: self.is_buy = False self.is_sell = False With this algorithm, we basically buy when an EMA "golden cross" happens and sell at "death cross". The results offer an improvement on the buy and hold strategy...

...in terms of returns! We end up with more equity at the end of the period, we did not avoid the rollercoaster of prices. It seems that the strategy is popular (and growing in popularity) and we are just following the broad market in the last parts of the back-test. This strategy is still not protecting us from the strong hand movements; open, close and volume considerations are ignored in this indicator set-up. What if we use another technical indicator that uses also some price range indication? We try with Zero-Commodity Channel Index for 14 periods as an example:

Bringing in some measure of price action reduces our total equity at the end of the period, also reduces the volatility of the account and the drawdown is 20% less than in the buy and hold strategy, we exchange some returns for some sense of safety in terms or reduced drawdowns. Some investors profiles may prefer this approach rather that the higher-returning buy and hold.
What if we finally bring the market volume into the calculation with a different indicator? We will use the price Ease of Movement indicator to account for volume changes in the price action:

We miss the best part of the party, but we do not stay to clean. By using a trend strength measuring indicator we would have obtained lower returns with lower risk, being a little bit more efficient in term of risk-reward ratio.
The combinations for indicator back-testing are unlimited, and initially it seems that adding a little bit of information from the technical side of price analysis could result in better risk adjusted returns for cryptocurrencies, assuming the largest example, Bitcoin, exhibits the correct currency characteristics.
It is early in the life cycle of this market. No one wants to miss out, not many want to take the risk. We see potential to adjust the opposing forces of risk and return in this market with more informed trading models, evolving the models presented in this post and beyond. Remember that the information contained in this post is not financial advice. If you want support in your asset management, including the perspectives of using cryptocurrencies, please contact us here at Ostirion.net. If you require any strategy development, testing, validation or general support we can help you.

Comments